|
Methods

Fig 2. Location of study sites
|
This study was set up with a complete randomized block design composed
of four separate sites with the same number and type of treatments on
each site (see Fig 2 for site locations). The sites were established in
2010 with the clone ‘Walker’ planted on a grid pattern with 2.8 m
spacing. Walker is typically intolerant of competition, therefore any
growth differences resulting from competition is amplified.
Within each of these sites 140 trees were selected for monitoring and assigned to one of four weed control treatments. See Fig 2 at bottom for a visual description of the study design and treatments. The assigned treatments were among the following:
|

Fig 3. Complete randomized block experimental design with four treatments
Vegetation assessments

Fig 4. Vegetation assessment methodology
For trees that had received the "cultivation only" treatment I performed vegetation assessments on their neighboring vegetation two times in each year (once in June and once in August). See Fig. 5 for study timeline.
Vegetation was assessed using a strip quadrat method with each strip consisting of a quadrat that was 25 cm wide x 35 cm long. Vegetation was recorded as percent cover by each species in each quadrat. Quadrats were numbered with values 1-3 with increasing distance from the tree bole. For each tree the assessment was repeated in every cardinal direction. See Fig. 4 at right.
Vegetation was assessed using a strip quadrat method with each strip consisting of a quadrat that was 25 cm wide x 35 cm long. Vegetation was recorded as percent cover by each species in each quadrat. Quadrats were numbered with values 1-3 with increasing distance from the tree bole. For each tree the assessment was repeated in every cardinal direction. See Fig. 4 at right.
Study timeline
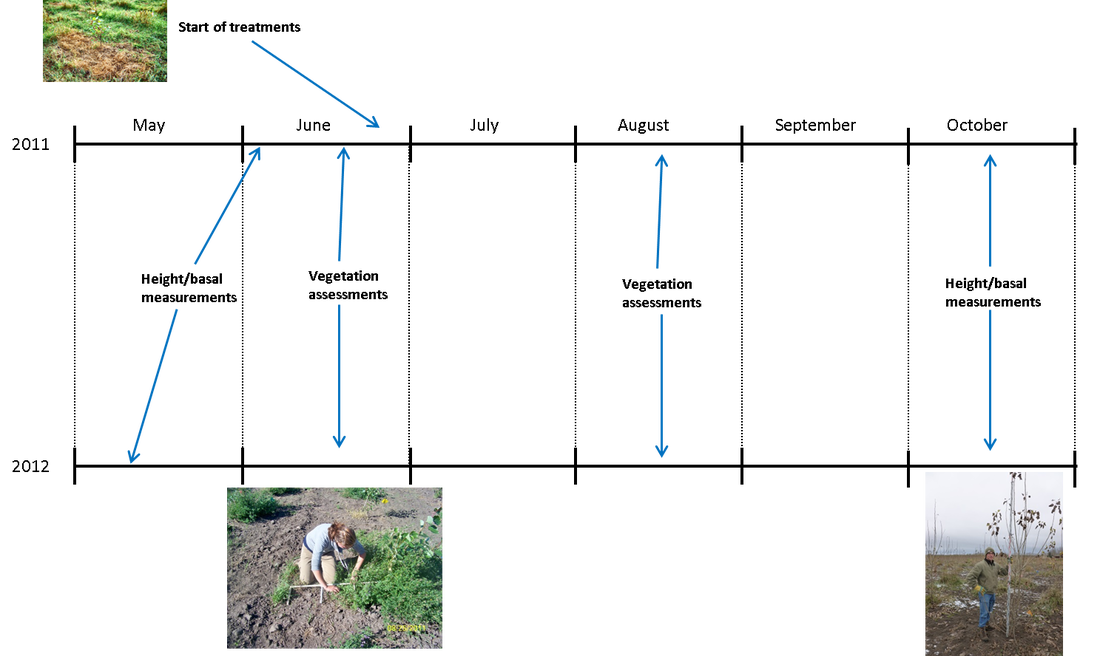
Fig 5. Timeline for field research tasks in years 2011 and 2012
Analysis
Objective 1:
To assess whether species composition plays an influence on tree growth I will perform a principal component analysis on the weed community data gained from my vegetation assessments with a Hellinger transformation. The points in the ordination will be the trees from which the vegetation assessments were gathered and the size of the points will be directly related to tree growth. With this analysis we should be able to see how trees perform when growing near different weed species..
To further assess the impacts of weed abundance, proximity, and composition on tree growth I will group my vegetation assessment data into plant functional forms (perennial forbs, annual forbs, and perennial grasses). That data will then be further classified into abundance by quadrat (recall Fig 4.) and year. Using a multiple regression tree analysis I should then be able to obtain a visual representation of which factors and their combinations are most responsible for influencing tree growth.
Objective 2:
To test for differences between the four vegetation control treatments I will use a one-way ANOVA with initial tree volume as a covariate and site as a random factor.
